Key Metrics we Tracked this MLS Season
By George Gallagher, Sen Nguyen & Clement Williams
One of the hardest tasks for ownership groups and chief executives within sport is getting to a point of near 100% confidence in the assessment of your own organization. In an increasingly data-driven world, there is a growing need to understand what’s important, and what’s just noise. Contextual, quantitative evidence has become vital in being able to effectively answer performance related questions such as “I see Team X isn’t doing well in the standings…why is that?”
Specifically focusing on the MLS in this piece, here at Sportsology Group we have identified and tracked four categories of metrics that we believe can paint a more accurate picture of team performance by unveiling and assessing some fundamental factors. Analyzing items such as Underlying Team Performance, Performance vs. Expectations, Injuries, and DP Performance, we believe gives us a more robust understanding of how an MLS team fares over the course of a season.
Underlying Performance
Although it is by no means unique or differentiated to evaluate, Expected Goals (xG) has become the first “port-of-call” when trying to “double-click” into team results. Specifically, Expected Goals Difference (xGD), which measures the difference between xG for
vs. Expected Goals Allowed (xGA), has become the go-to statistic to more accurately measure the original underlying performance metric of Goal Difference (GD).
Given how common it is to measure within the global soccer community, there is no need to over-explain or elaborate on this statistic. It is just key to mention whenever discussing contextual data.
Using data from Fbref, the following table represents the top five teams in terms of xGD:
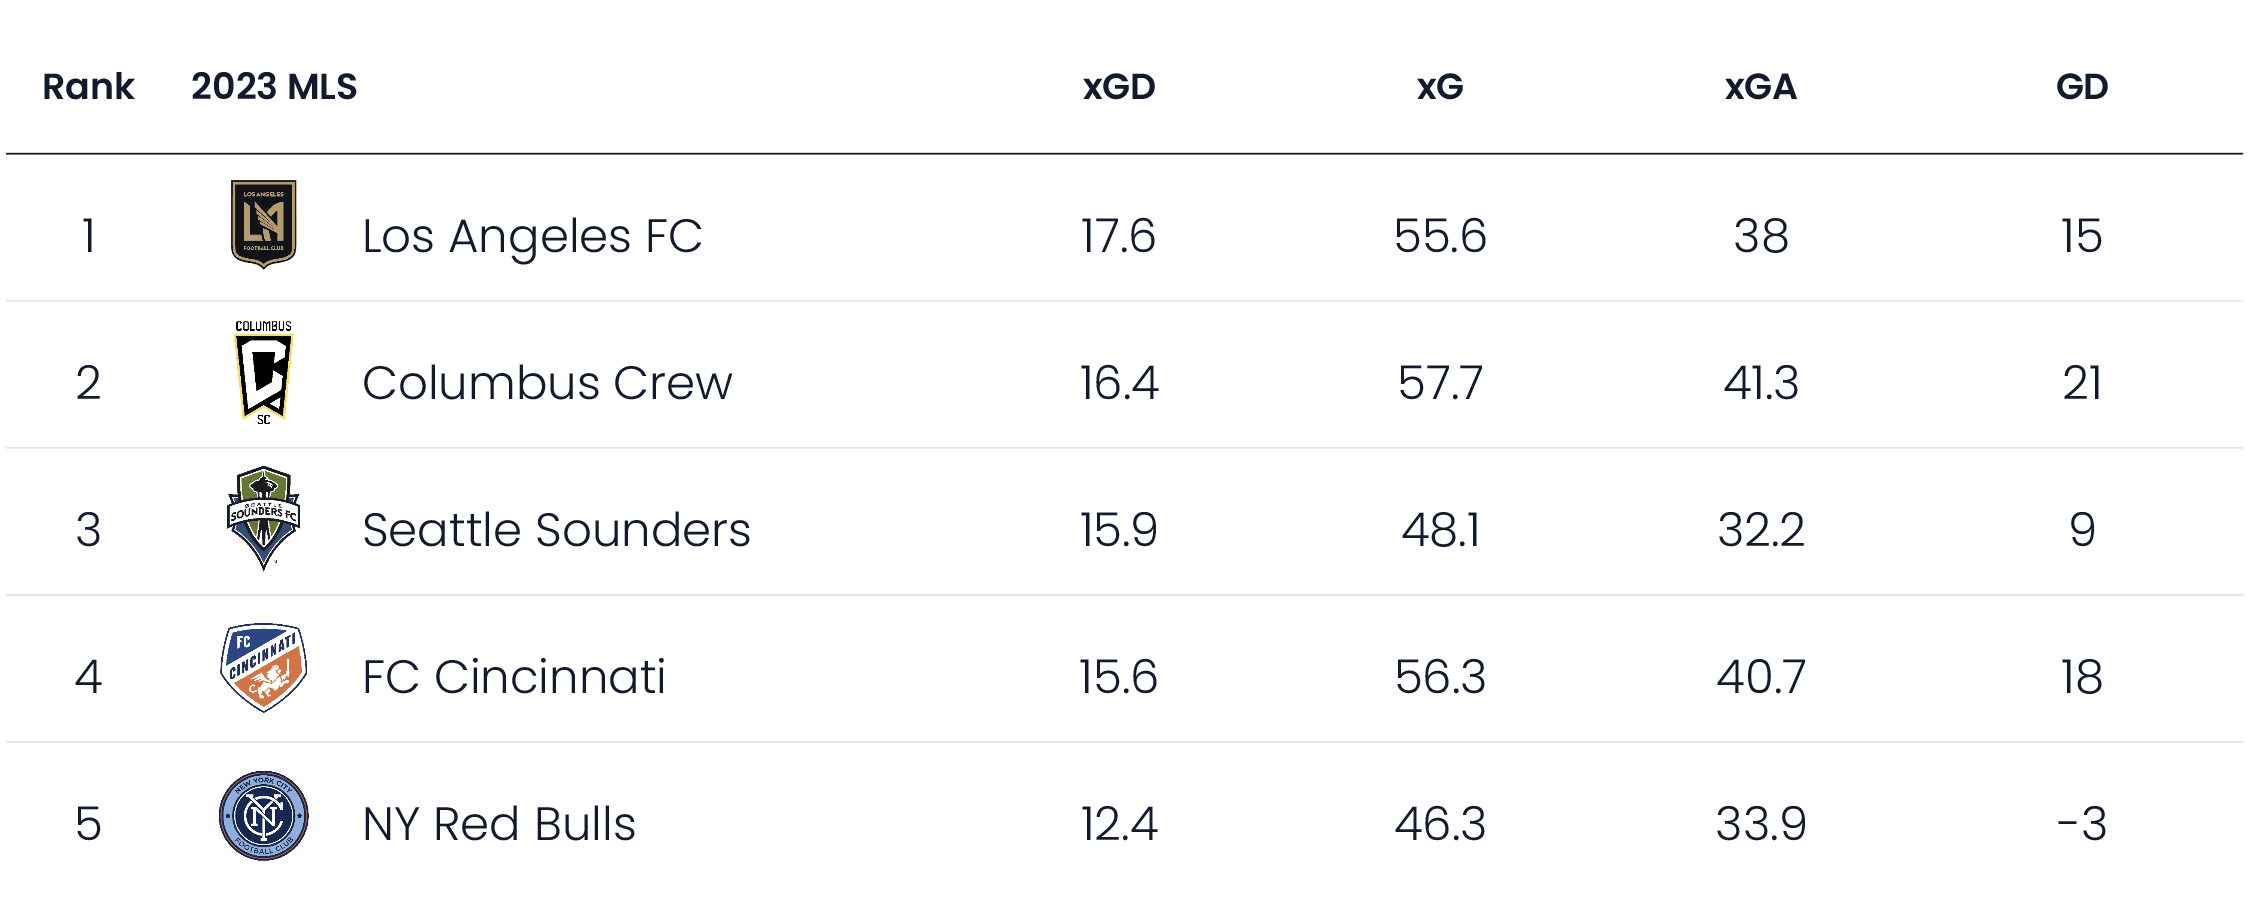
Even with several key attacking pieces departing since last season, LAFC’s attack, spearheaded by Golden Boot winner Denis Bouanga and captain Carlos Vela, helped the team achieve top spot for xGD numbers even with the 6th-best defense overall.
For the Crew, while Cucho contributed greatly to their xG numbers, their overperformance was primarily driven by the now-departed Lucas Zelarayán who contributed 16 goals and assists from an expected 12.8. FC Cincinnati, the other slight over-performer on this list, is led by MVP-finalist Luciano Acosta who contributed to 27 goals from an expected 16.8.
On the other hand, while both underperforming their xGD, Seattle Sounders edged out New York Red Bulls by performing just how their xGA number suggested. The Sounders, boasting the meanest defense in the league, conceded 32 goals from 32.2 xGA whereas the Red Bulls conceded 39 from 33.9 xGA. At the heart of both defenses were Colombian center-backs: Yeimar Gómez for Seattle and Andrés Reyes for New York. Neither one excelled in tackles or blocks but both led the league in interceptions, Yeimar with 73 and Reyes with 61, while no other player broke the 60-interception mark.
Performance vs Expectations
While xGD might retroactively tell a story of how games and seasons played out, it still will be missing certain key contributing factors. Player availability, team momentum, weather, rest in between games, home-field advantage, etc. all represent additional elements that affect game results. Although it can be overwhelming to consider how to best take into account all these different data points, it turns out someone has already done this for us: Betting Oddsmakers. By analyzing expectations, defined as betting odds, from a number of trusted providers, we believe we can better understand how teams perform versus what is expected from them for every game.
Having said that, we do believe measuring over- and underperformances within games is important. Therefore throughout the season, we used the difference between xGD and actual GD to track how teams might have been “lucky” over a large collection of matches. Looking at the 2022 season compared to the 2023 season, we can see how Austin’s overperformance to their expected goal differential and New England and Atlanta’s relative underperformance last season have led to a “regression to the mean.” This season Austin finished 10 spots lower than they did in 2022, while New England and Atlanta both finished five spots higher.
In the table below, we highlight the biggest boosts in Preseason Rank due to betting odds (the higher the number, the more places the team finished ahead of preseason expectations) while also showing that difference in the expected and actual goal differences (a lower number indicates the team had a higher goal differential than what was expected, and therefore could have been considered lucky).
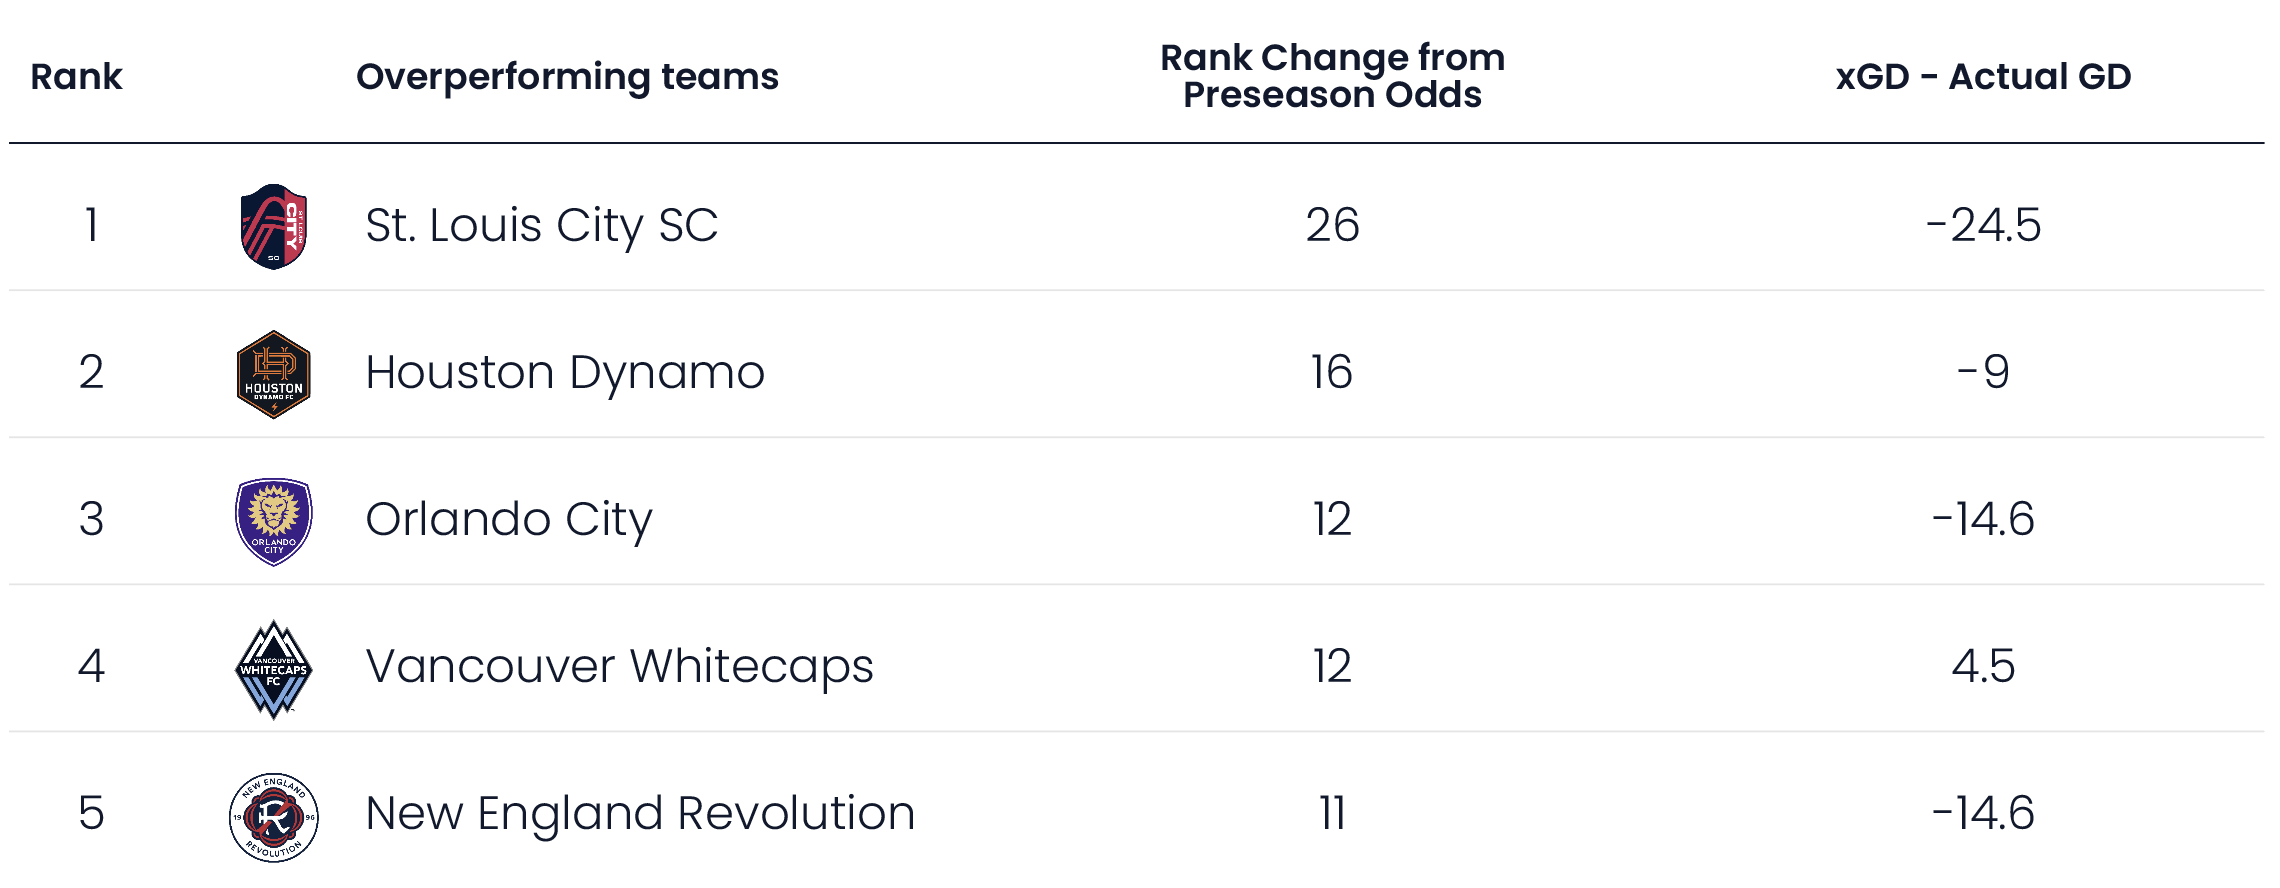
While St. Louis City SC exceeded their expected place in the league by a staggering 26 places, this was most likely driven by an overperformance of their xGD by 24.5 goals. Although we mentioned this would indicate the team might fall back in the standings next year, it will be interesting to see how the team tries to build and improve within this regard.
St. Louis’ impressive achievements this season were denoted by some notable overperformers. On the offensive end, Samuel Adeniran and DP João Klauss scored nearly double their expected numbers, with the former netting 8 goals from 3.9 xG and the latter bagging 10 from 5.8 xG. This spilled over to DP Eduard Löwen’s role as he registered 9 assists from an expected 3.7. In defense, ex-Dortmund goalkeeper Roman Bürki topped the league with 9.1 goals prevented above expectations.
The overperformance of Orlando City can largely be attributed to Duncan McGuire who, in his first professional season, scored 13 goals from 5.3 xG. With the reportedly lowest wage bill in the league, Orlando City was only one of three teams to have 4 double-digit goal contributors. This group, consisting of McGuire, Facundo Torres, Martín Ojeda and Iván Angulo, edged out the other two teams - namely Sporting Kansas City and St. Louis City SC - with a total of 57 goals and assists from an expected 40.1.
Injuries
A major contextual factor for any team when explaining their performance is injuries. Not having high-impact players in key games throughout the season can hijack momentum quickly.
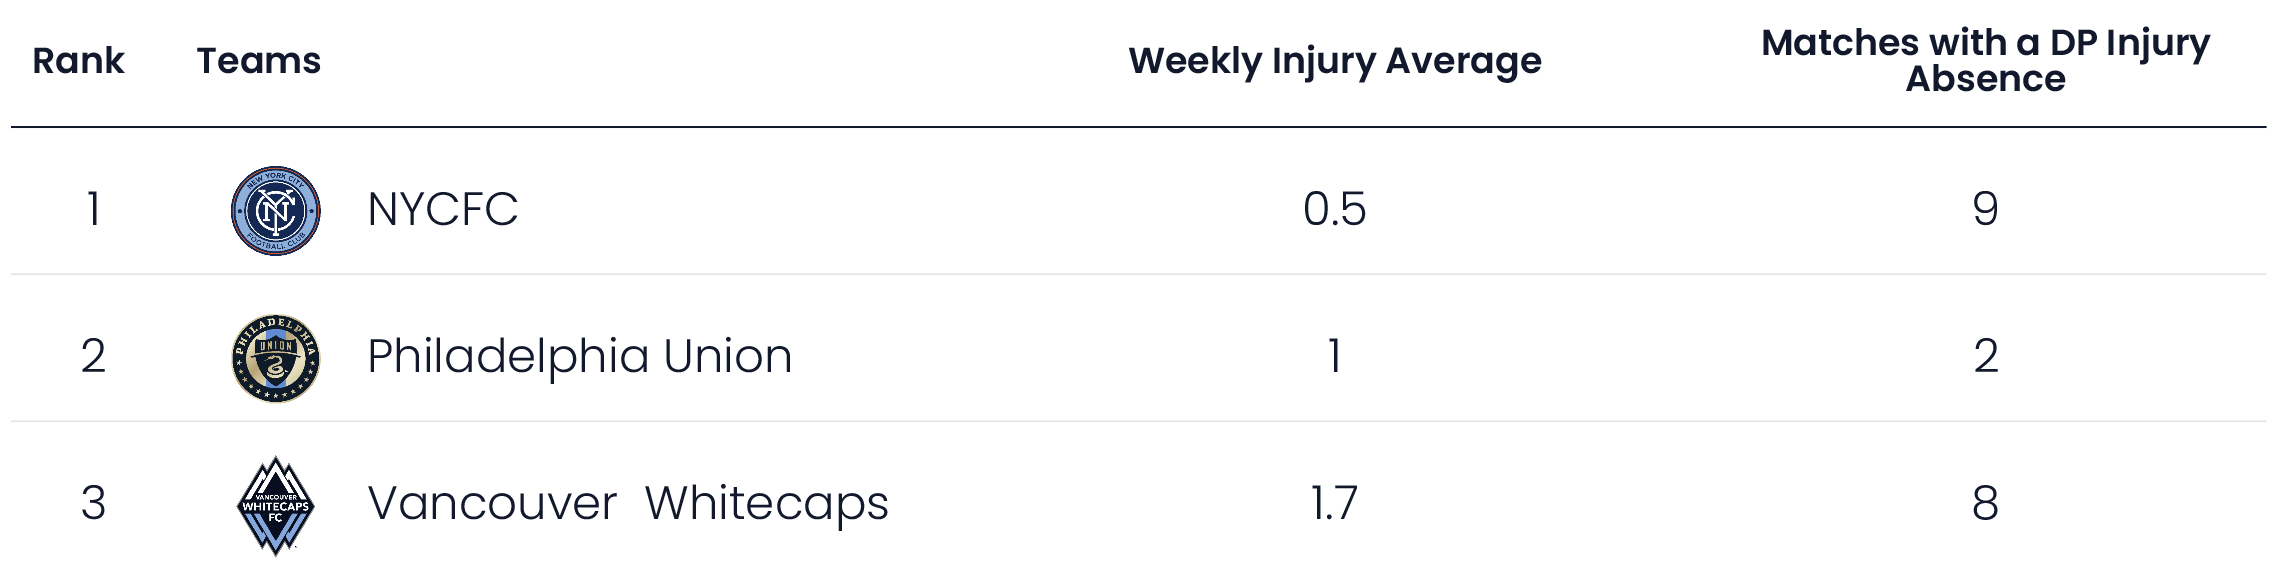
Thus, we decided to not only create and maintain this season a database of injuries by tracking it week to week, but also made sure to note when those injuries were to team DPs. Below, you can see which franchises were most injury-bitten this past season.
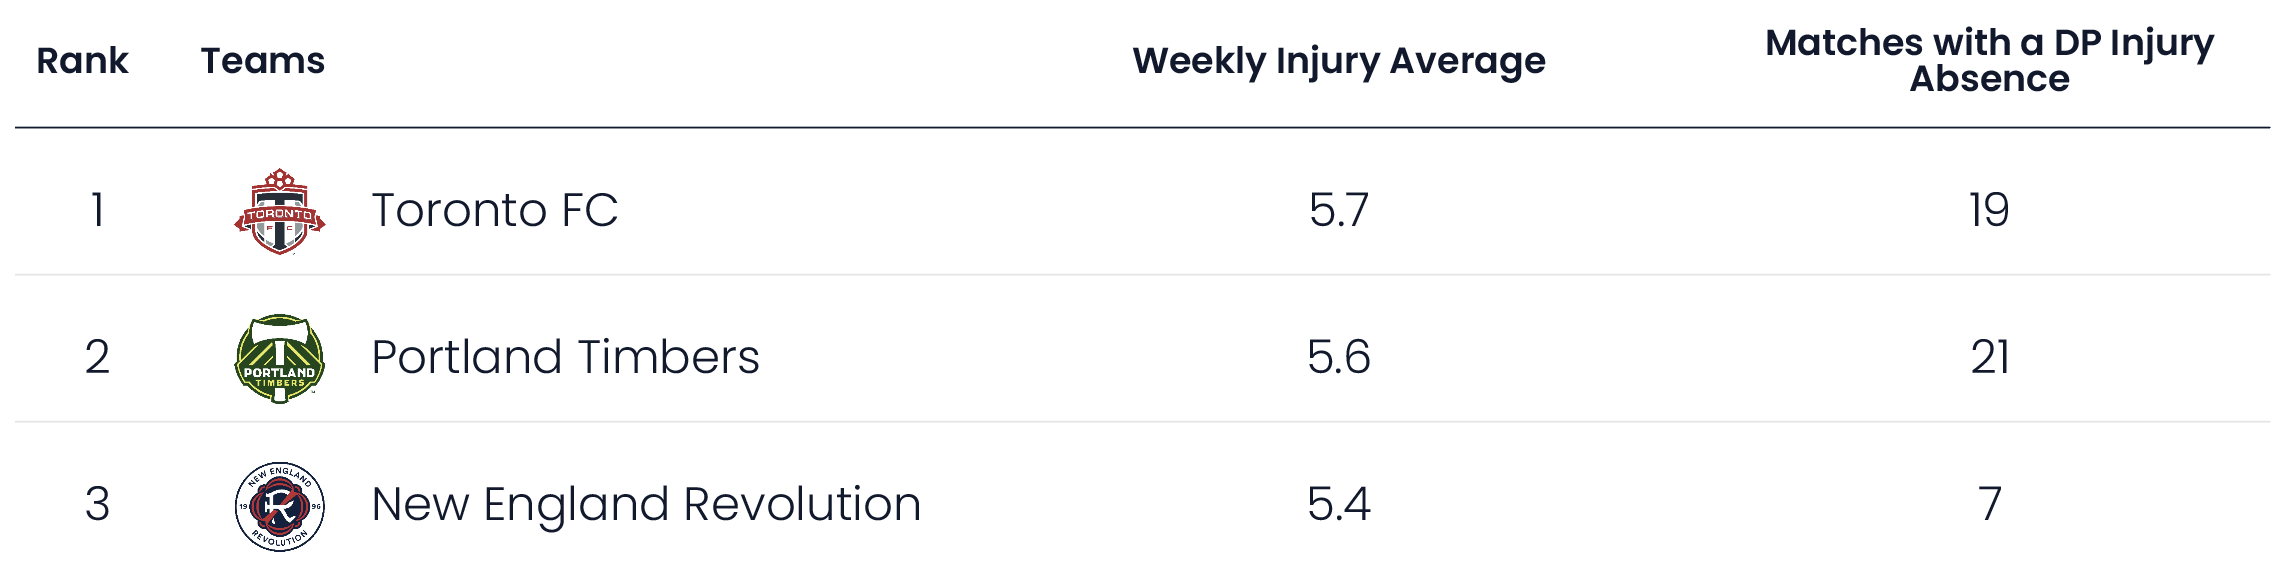
Toronto FC, despite having the league’s highest payroll behind Inter Miami, were also the worst affected by injuries. Not only did they have the highest average injury rate in the league, but they also were top 5 in weeks missing a DP due to injury. It is worth noting the probable effect that this inability to have consistent lineup continuity contributed to Toronto’s last-place finish amongst other factors.
Playoff Qualification Stats
We found somewhat intuitively that teams with fewer injuries tended to do better in the league. 8/10 teams with the lowest weekly injury average qualified for the postseason. By contrast, of the teams worst-afflicted by injuries, just 40% qualified for the playoffs. Overall, just two teams with below 3.0 injury absences per week missed out on playoff qualification. In a similar vein, DP injuries played a significant role, as 8/10 teams with the fewest DP injury absences qualified for the playoffs, but just 5/12 (including the 3 teams tied for 10th) with the most DP injury absences qualified.
DP Performance
Given the constraints of the league salary cap and roster rules, MLS teams have to be very conscientious of how they allocate resources. MLS creations such as designated players, targeted & general allocation money, supplemental roster spots, etc. all highlight methods, in addition to their salary cap, that restrict the ways MLS teams can deploy resources. Because of this, an organization cannot simply outspend others as a sustainable strategy for success. In fact, in 2023 just one club (Atlanta) with a top 7 payroll actually made the playoffs.
Viewing these DPs as first-round or lottery draft picks, given their rare and outsized importance on roster construction, exemplifies why teams in the MLS have to be incredibly strategic in how they identify and recruit them. Therefore, understanding how well these DPs are performing is key to measuring how successful a team is throughout the season.
To measure this, we looked at the summation of each team’s DPs Goals and Assists (G+A), this number paired up to their DPs xG+A, and also how many minutes a team’s DPs played. Understanding that measuring the impact of DPs who play roles in their teams where they’re not expected to score or assist on goals (goalkeeper, defenders, defensive-midfielders) is difficult, we tried to use minutes as some type of proxy for this. Not captured in the table below, but using metrics such as the difference in post-shot xGA and goals allowed or American Soccer Analysis’ “Goals Added (g+)” statistics are other proxies for this category of player.
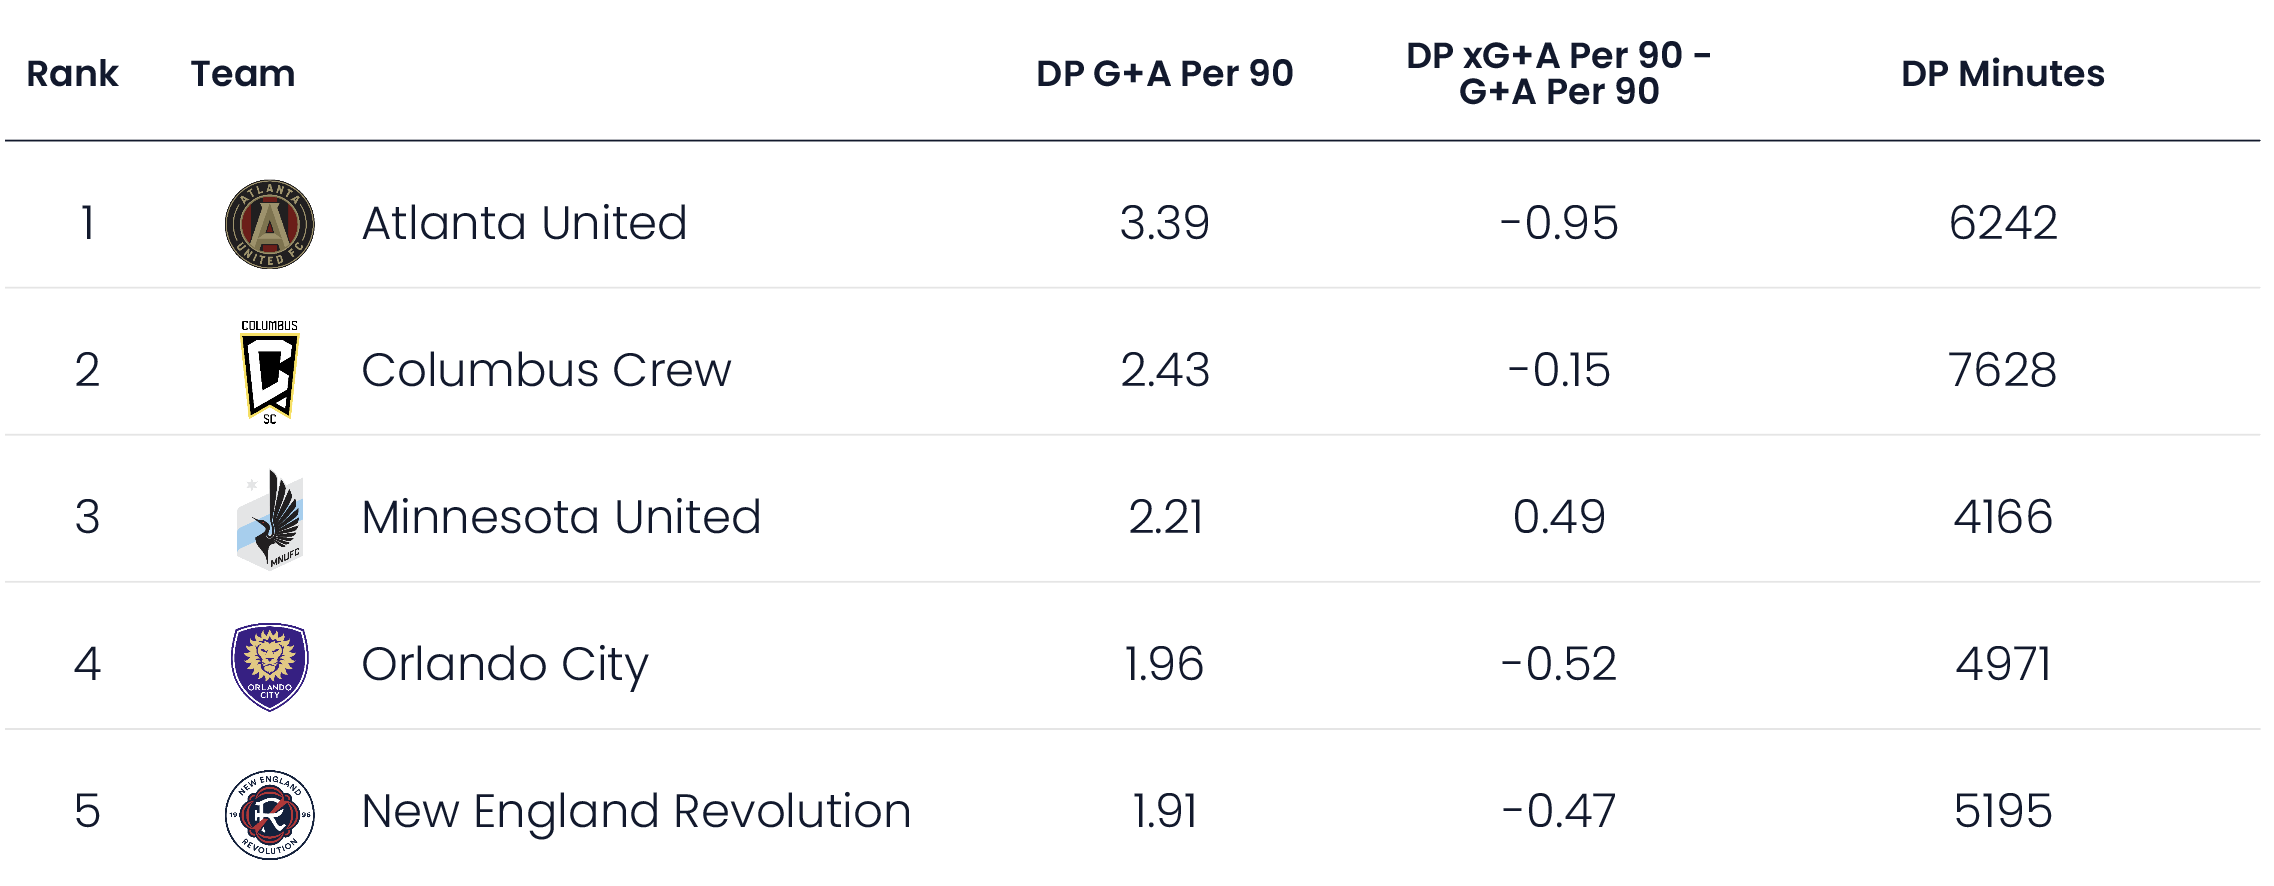
Admittedly, Atlanta’s numbers are slightly skewed based on the small sample size we have of Saba Lobzhanidze who hit the ground not just running, but sprinting, upon his arrival in the summer window (7 G+A in about 5 full matches worth of minutes). Even with that, the performances they received out of 2023 Newcomer of the Year finalist Giorgos Giakoumakis and 2022 Newcomer of the Year winner Thiago Almada were key to their success this year.
Columbus maximized their DP performance this past season, replacing long-time star Zelarayán with Diego Rossi over the summer without really missing a beat.
Perhaps surprisingly, despite missing the playoffs, Minnesota had the highest expected DP performance in 2023, and returned a top 5 DP G+A per 90. However, they were the only team in that top 5 that actually underperformed their expected DP figure; of the 4 DPs that featured for them in 2023, only midseason signing Teemu Pukki overperformed his xG+A contribution.
Conclusion
Numbers don’t lie, but they don’t always tell the full truth. From what we’ve seen in the market, the best organizations are those that can replicate the childlike curiosity of persistently questioning “Why?” to exhaustion in the quest to peel back the layers of what the data is actually telling you.
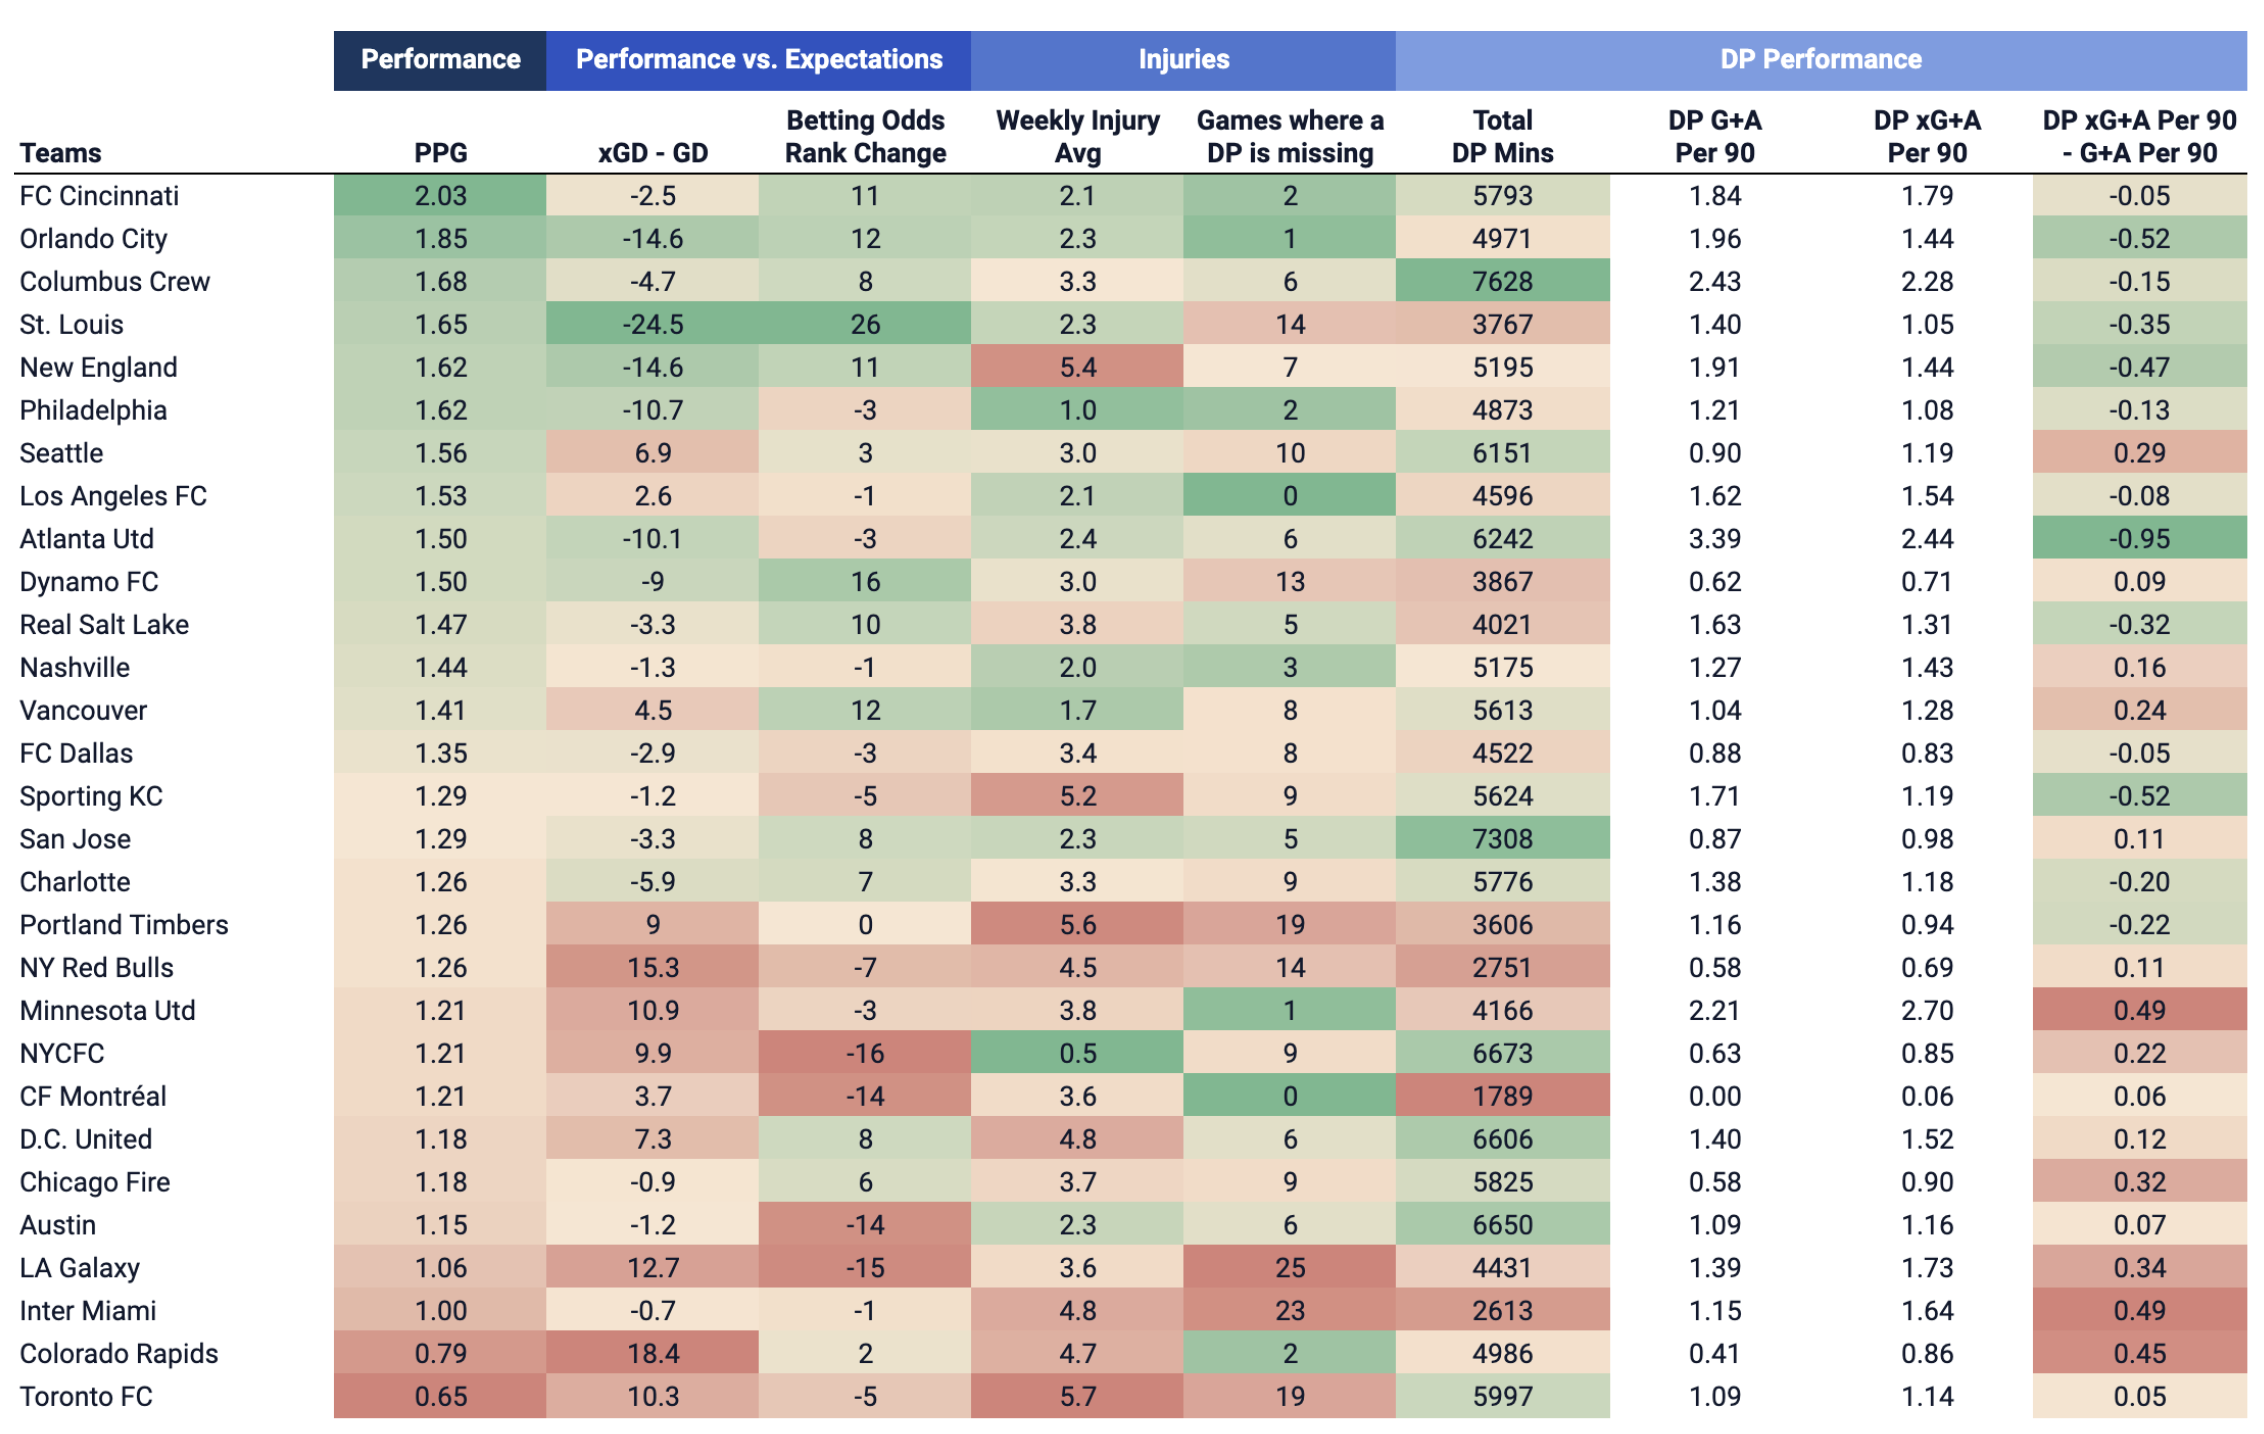
By looking at some of these underlying metrics, we feel we are able to get a better sense in explaining each MLS team’s performance this past season. See below for a full capture of the data we discussed in this piece.