
2024 Key Considerations for MLS Success
Contributions by Sen Nguyen and Cam Kerr
At the end of last year, we published the key metrics we tracked throughout the MLS season to provide more contextual information on each team’s performance. With the 2024 season kicking off this past week, we wanted to share some insights and learnings we’ve gained while analyzing what makes a team successful in this league based on annual research we’ve conducted the past few years. Here are our main takeaways, with more detail provided throughout this piece:
DPs have less impact on team success than we previously thought
The advent of the use of data & analytics in player identification and scouting has not meaningfully expanded the global reach of DP recruitment
We know spend and performance aren’t correlated in the MLS, but that hasn’t always been the case
Prior experience is no longer a strong factor when predicting whether a Head Coach or GM will be successful in their role
Certain teams are definitely more efficient with their use of Allocation Money spend, but this usually comes down to the performance of a small number of players
Designated Player Impact
One of the first things someone says when talking about how to be successful in the MLS is some variation of: “You've got to get your DPs right”. It’s nearly become dogma in this market, and to suggest otherwise could be viewed as foolish or nonsensical. Now while we are not necessarily challenging this notion, we failed to find statistical evidence to back it up.
When discussing DPs, given how limited of a resource they are on MLS rosters, it’s also often said that it’s important that this designation is used on players who can directly contribute to scoring goals (i.e., strikers, attacking midfielders, wide forwards). Thus, below we plotted down each team’s cumulative goals and assists provided to them by their DPs against their Points per Game (PPG) since 2017.
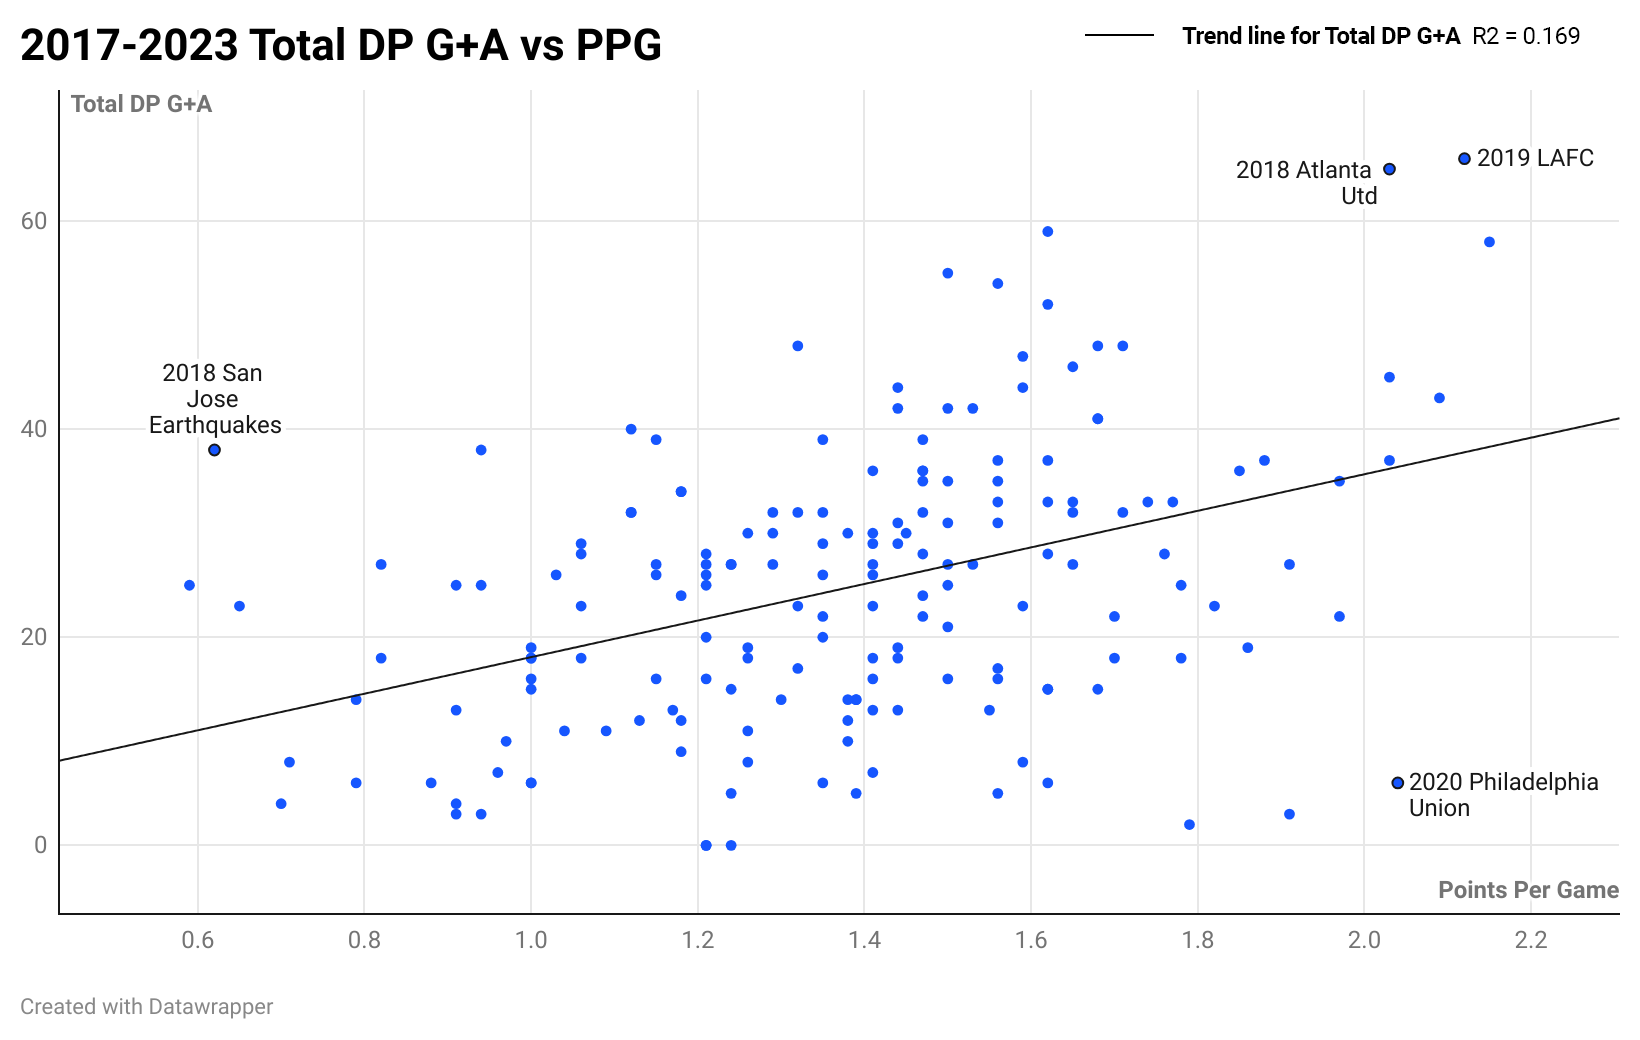
As you can see, while there does exist a positive relationship between the two, there is not an apparent strong correlation with an R-Squared value of just 0.169. While we do see a recent jump in correlation, as 2023’s data had an R-Squared value of .302 and the median of 2017-2022’s values was .187, the sample size of just one season’s data is not large enough to warrant labeling this as a notable trend.
Now, a fair retort to this analysis would be that there are other factors within the game of soccer that contribute to team success and while goals and assists are important, they aren’t everything. What this performance metric misses is the impact of a defensive midfielder who is constantly stopping counter-attacks via interceptions and tackles or a center-back who is winning every contested header and clearing danger left and right. To that end, we decided to evaluate this question with another metric: Goals Added (G+). Developed by American Soccer Analysis, this metric essentially “measures a player’s total on-ball contribution in attack and defense. It does this by calculating how much each touch changes their team’s chances of scoring and conceding across two possessions”.
The objective of using a metric like this is to provide a more accurate representation of the impact players, in this case DPs, have on increasing their team’s chances of winning.
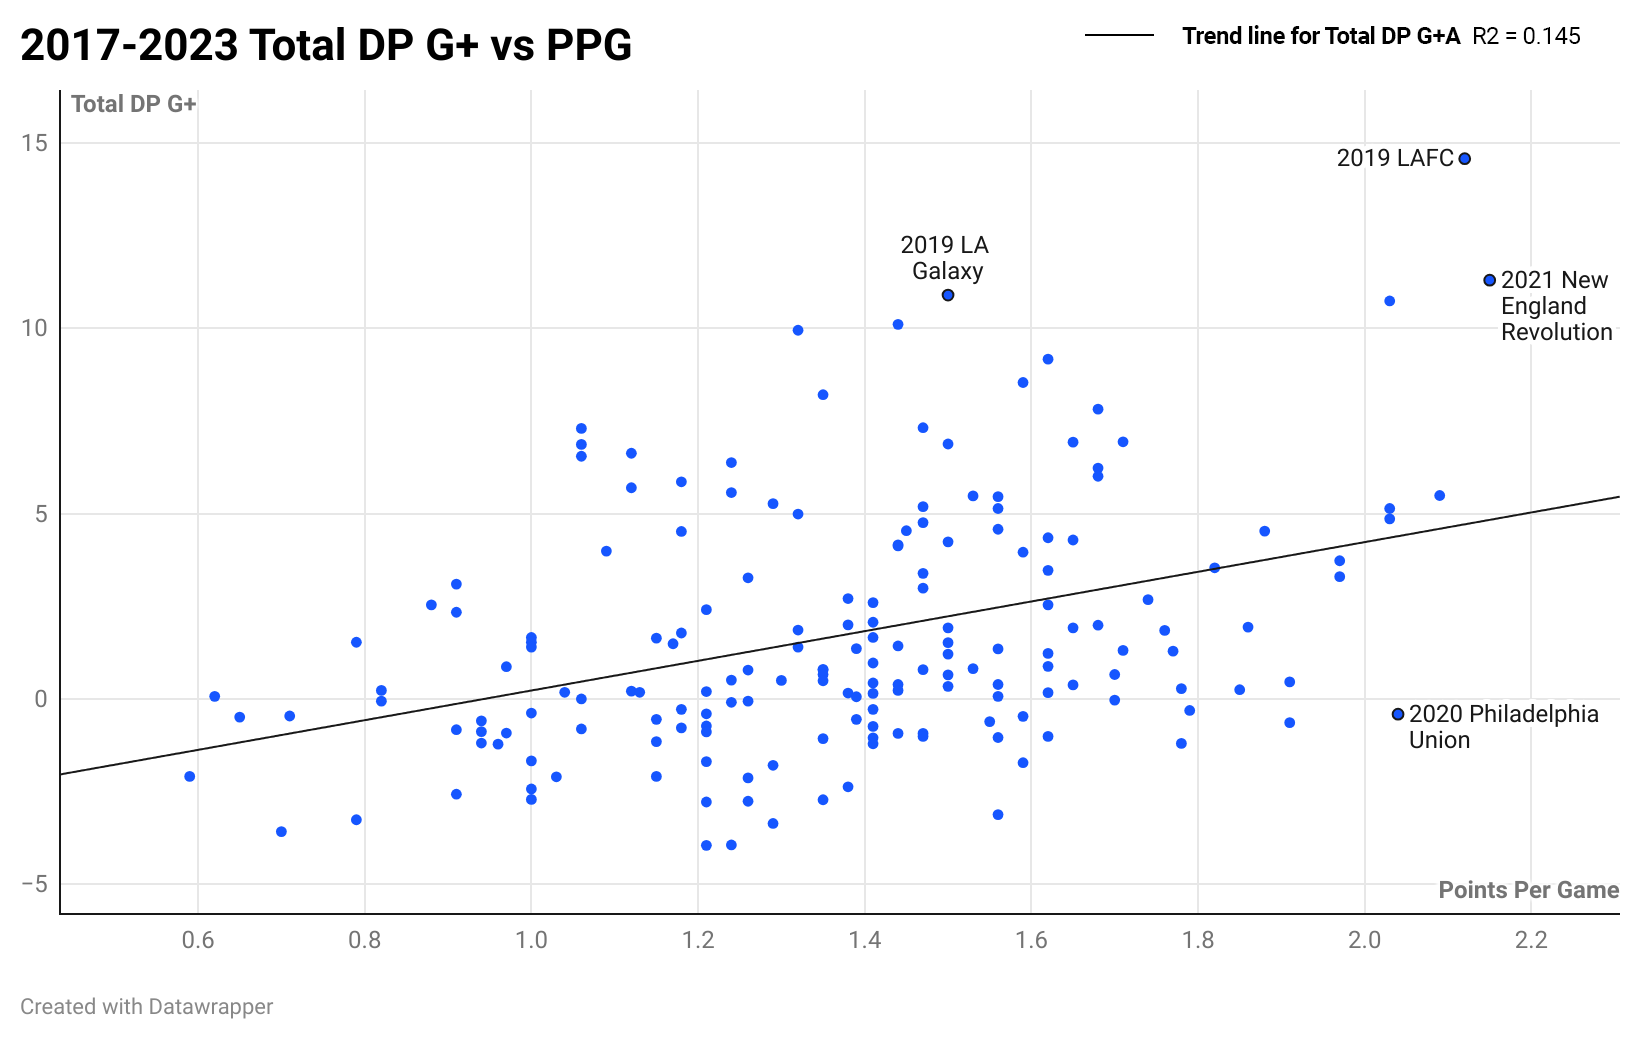
After conducting this analysis though, it does not seem as if there is a strong correlation between these two variables. In fact, the correlation is actually weaker than when evaluating just goals and assists. Although G+ does have some shortcomings, namely that it only measures on-ball actions (which means rewarding / punishing defenders for their actions throughout a game can be quite tricky), the result is the same: we still haven’t been able to produce statistical evidence that “you NEED to get your DPs right”.
Designated Player Origins
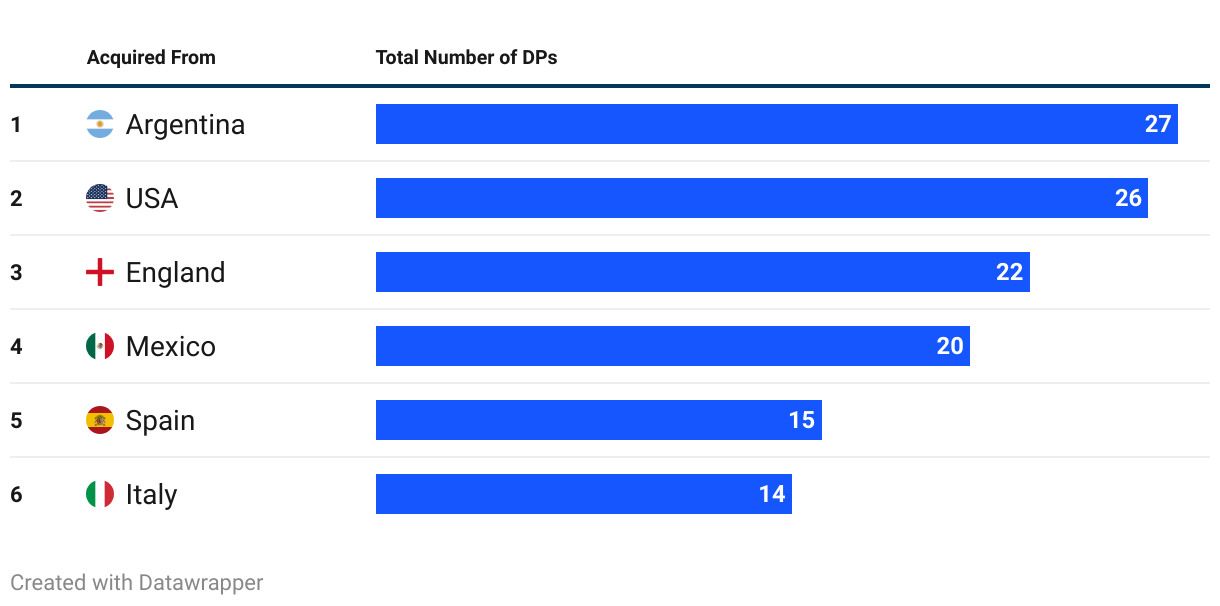
Since 2017, the nationalities of DPs represent some of the biggest powerhouse countries in Western Hemisphere soccer. Excluding the U.S., the top six most popular nationalities of DPs since then have been Argentina, Brazil, Mexico, Colombia, Paraguay and Uruguay. Though, when evaluating the actual countries where these DPs played before coming stateside, the narrative shifts to include some of the most decorated European nations. The top six, besides the U.S., consists of Argentina, England, Mexico, Spain and Italy. So, if you were to summarize this information, one would say: since 2017 the MLS has primarily attracted South American and Mexican DPs, some who played in their home countries before arriving but also some who are coming in from some of the biggest leagues in Europe.
Since 2017, Top Countries Where DPs Have Been Recruited From
Now, with the growth and advent of data and analytics use within player recruitment in recent years, one would expect that this dynamic would have shifted. As clubs gained access to databases with players from all over the world in never-before-explored leagues, one would expect more diversity in countries where DPs are acquired from, right? Well, the data actually tells somewhat of a mixed story…
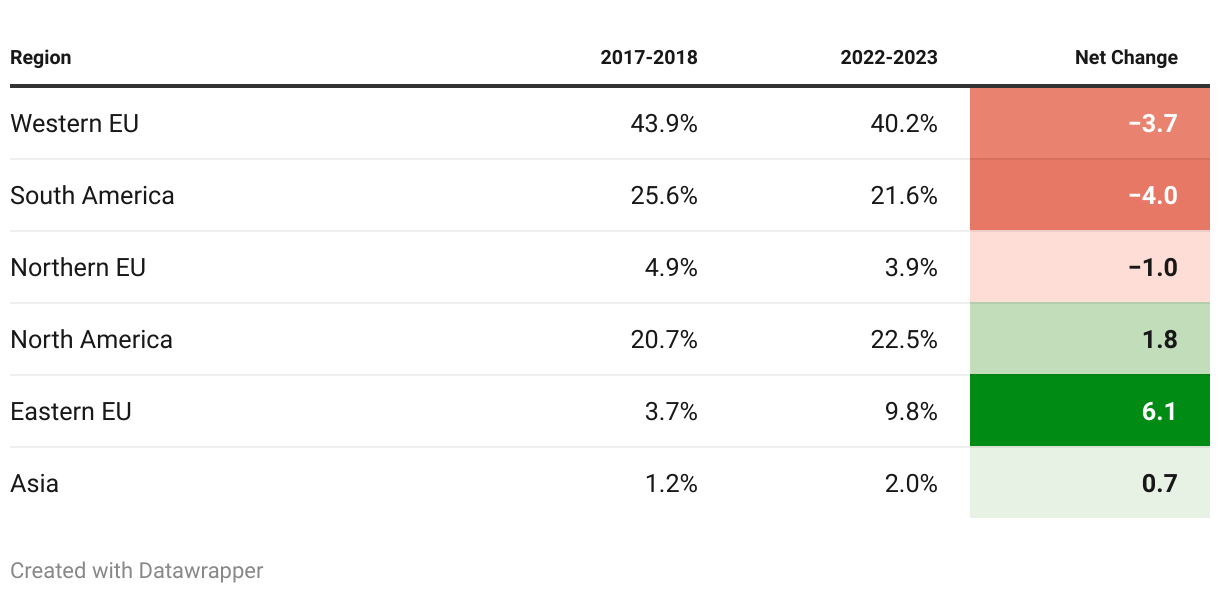
Between 2017-2018, DPs were acquired from 23 different countries. Between 2022-2023, this number only jumped to 28. From a regional perspective, we also saw little change when comparing these points in time. While Eastern Europe experienced the most notable amount of change between those two time periods, there wasn’t that high of a discrepancy across the other regions.
% of DPs Acquired From Global Regions, 2017-2018 vs. 2022-2023
However, when comparing country by country, one can see a more detailed summary of how DP recruitment has changed between these two time periods.
Number of DPs Acquired From Countries, 2017-2018 vs. 2022-2023
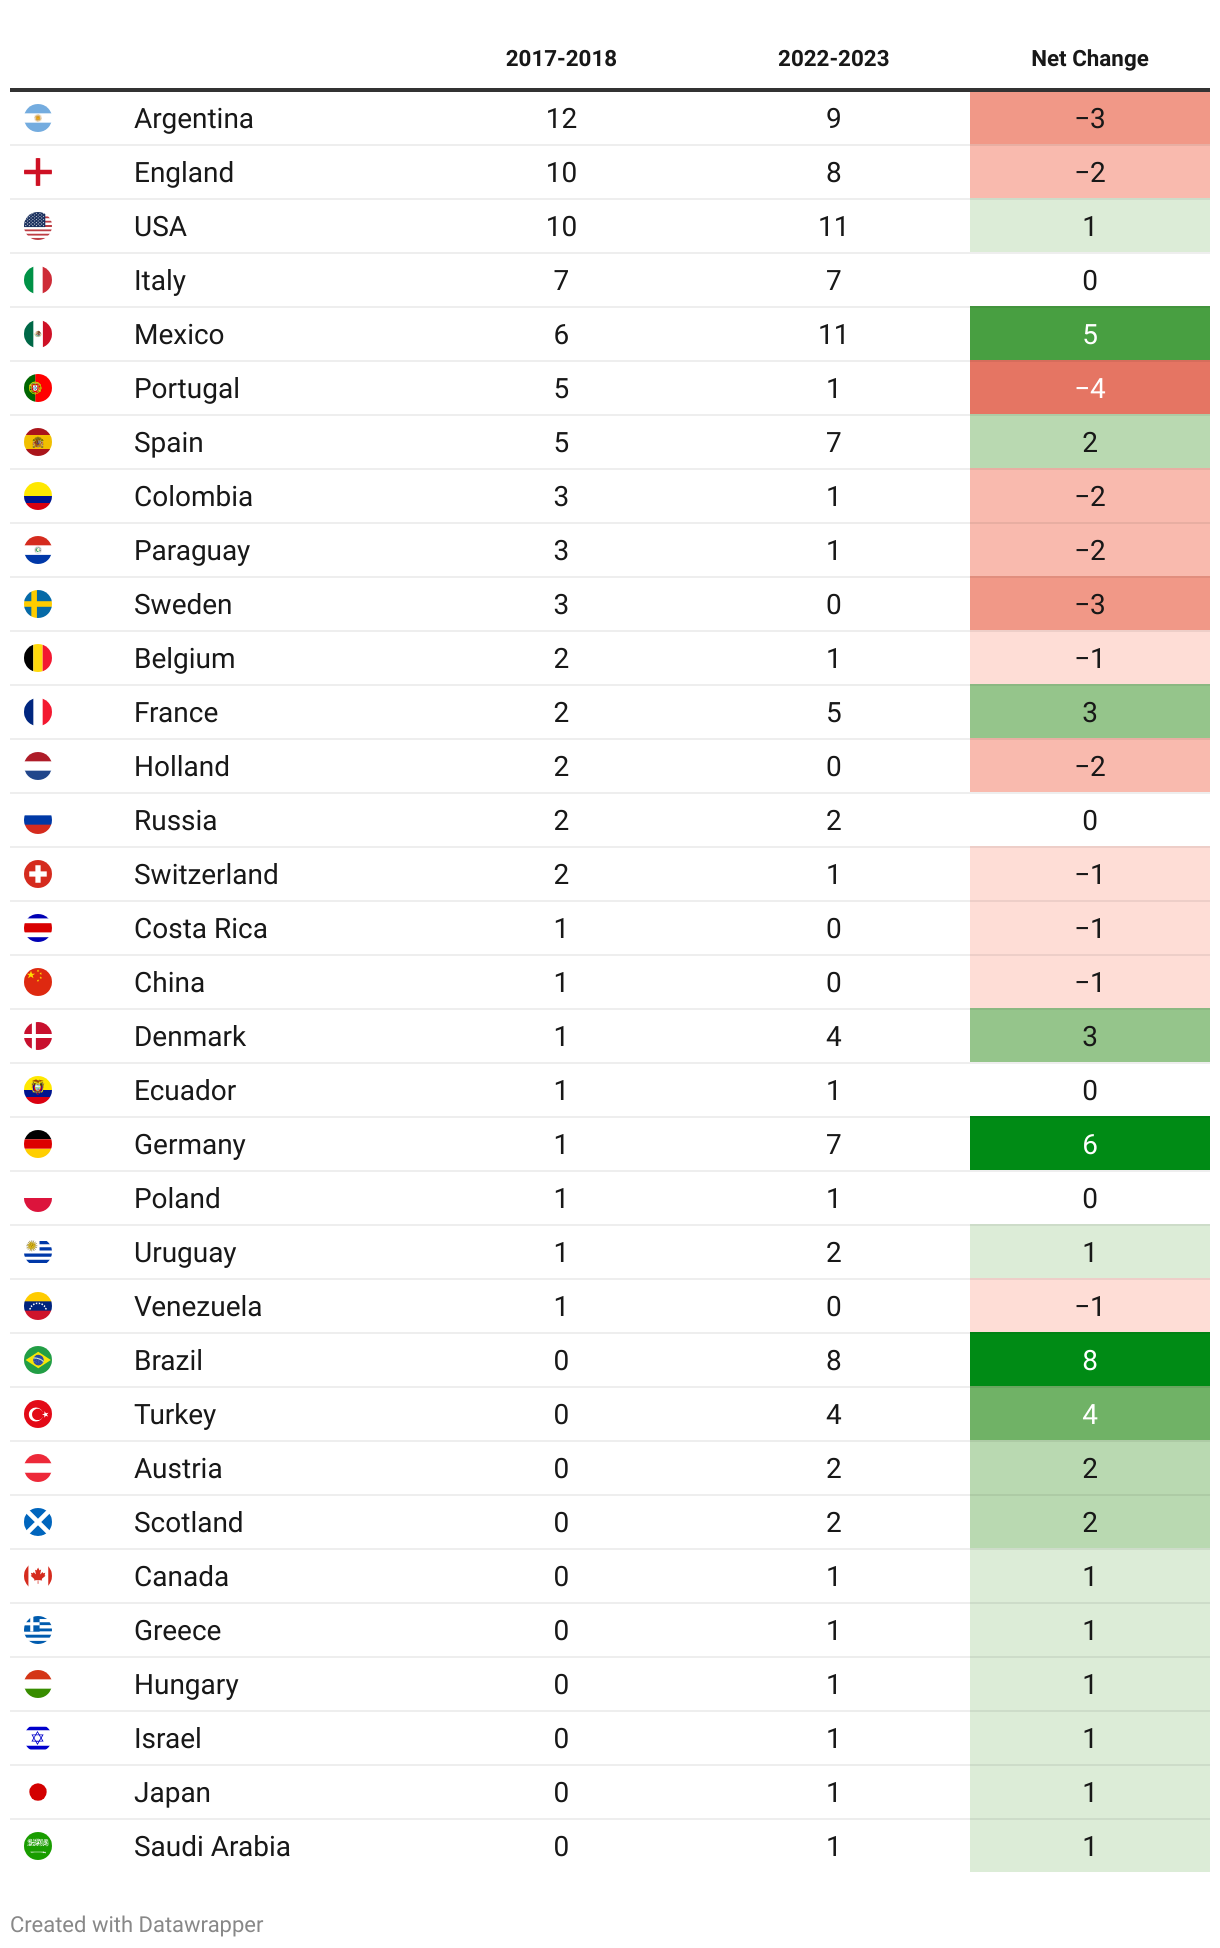
While there are some notable changes such as Brazil previously having not provided a single DP to becoming the fourth most popular target, the ascendancy of Mexico to now be tied with the U.S. as the most prolific supplier, or the jump of countries such as Turkey and Denmark, it’s difficult to say with confidence that there’s been a massive transformation in this space. Admittedly, the small sample size also makes it difficult to make any hard assertions. Although the growth in recruitment from countries like Brazil, Germany and Mexico could indicate the increasing spending ability MLS clubs have in the transfer market, this could be due to a variety of factors.
In future analyses, it would be useful to open up the sample size to all players and not just DPs, while also including the specificity of which leagues these players are coming from. This way, we would be able to more accurately measure how diverse player recruitment has or has not gotten in the last 5+ years.
Spend vs. Performance
While multiple studies have shown over time that total payroll and team performance is strongly positively correlated in major European leagues, that is not the case in the MLS.
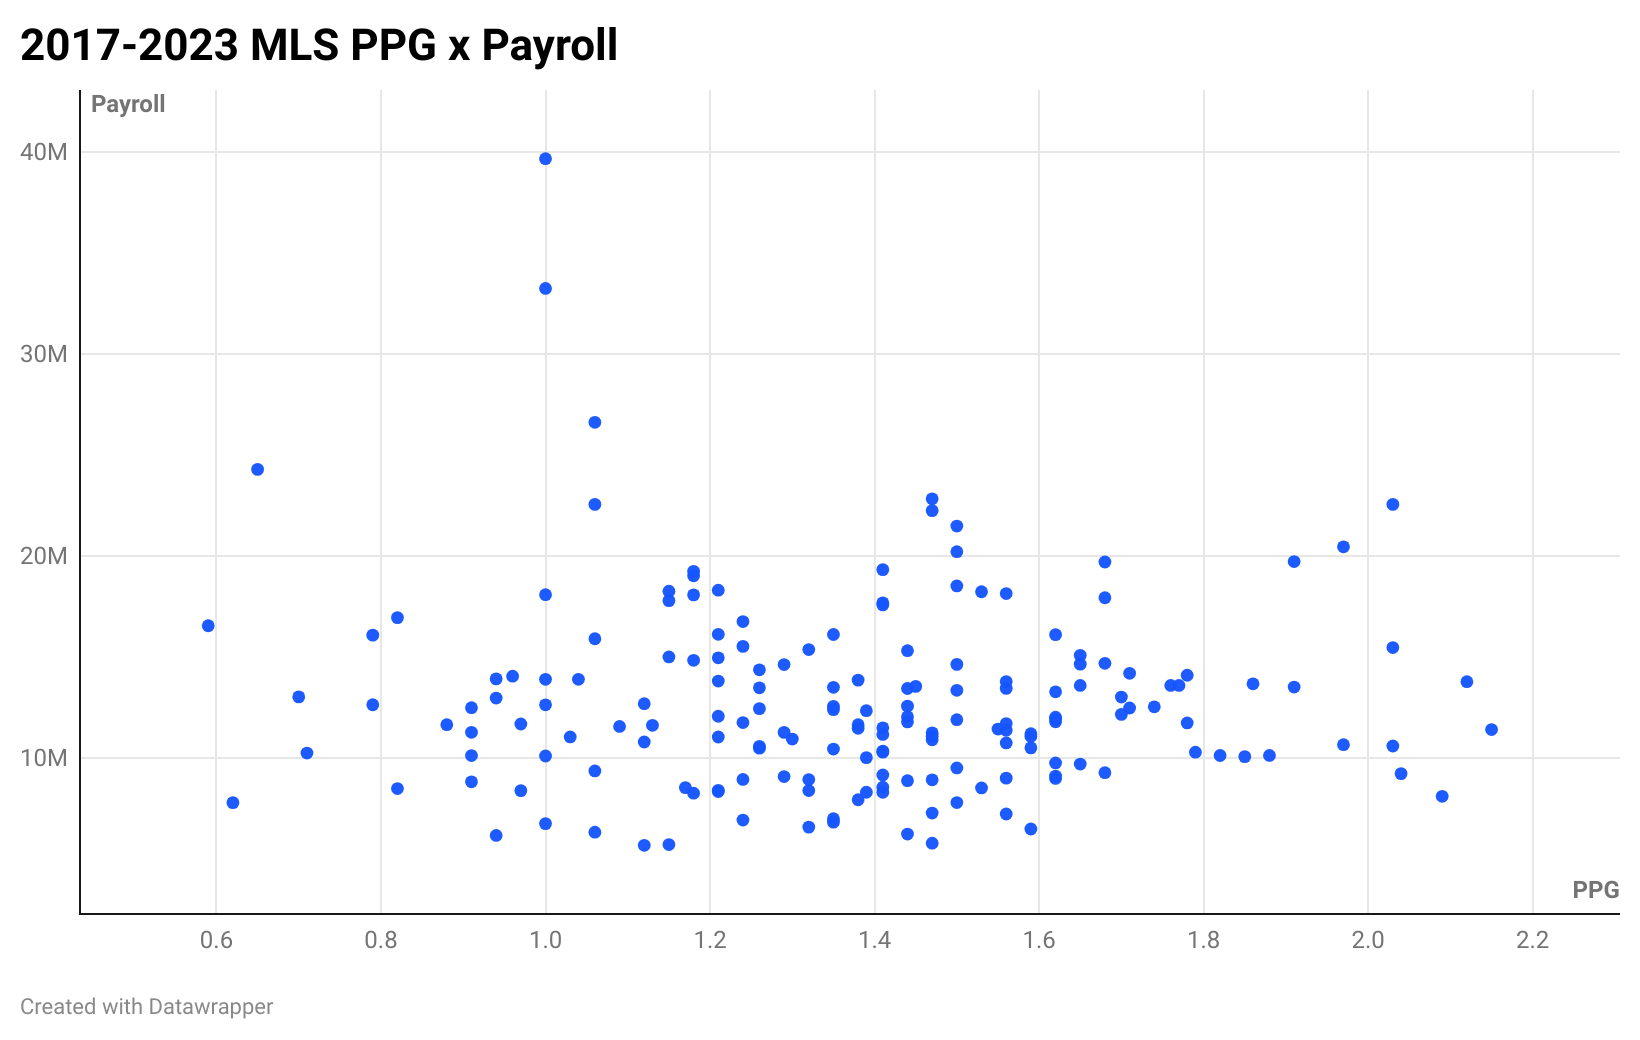
Even when adjusting for different metrics (xG, transfer spend, etc.) this trend, or lack of trend, persists for the MLS. In a salary capped league, this is to be expected when compared to European counterparts which historically have had less stringent or concrete payroll regulations. Interestingly enough though, this trend has changed over time. By evaluating the R-value of the relationship between PPG and payroll over time, we can see how this correlation has changed since 2017.
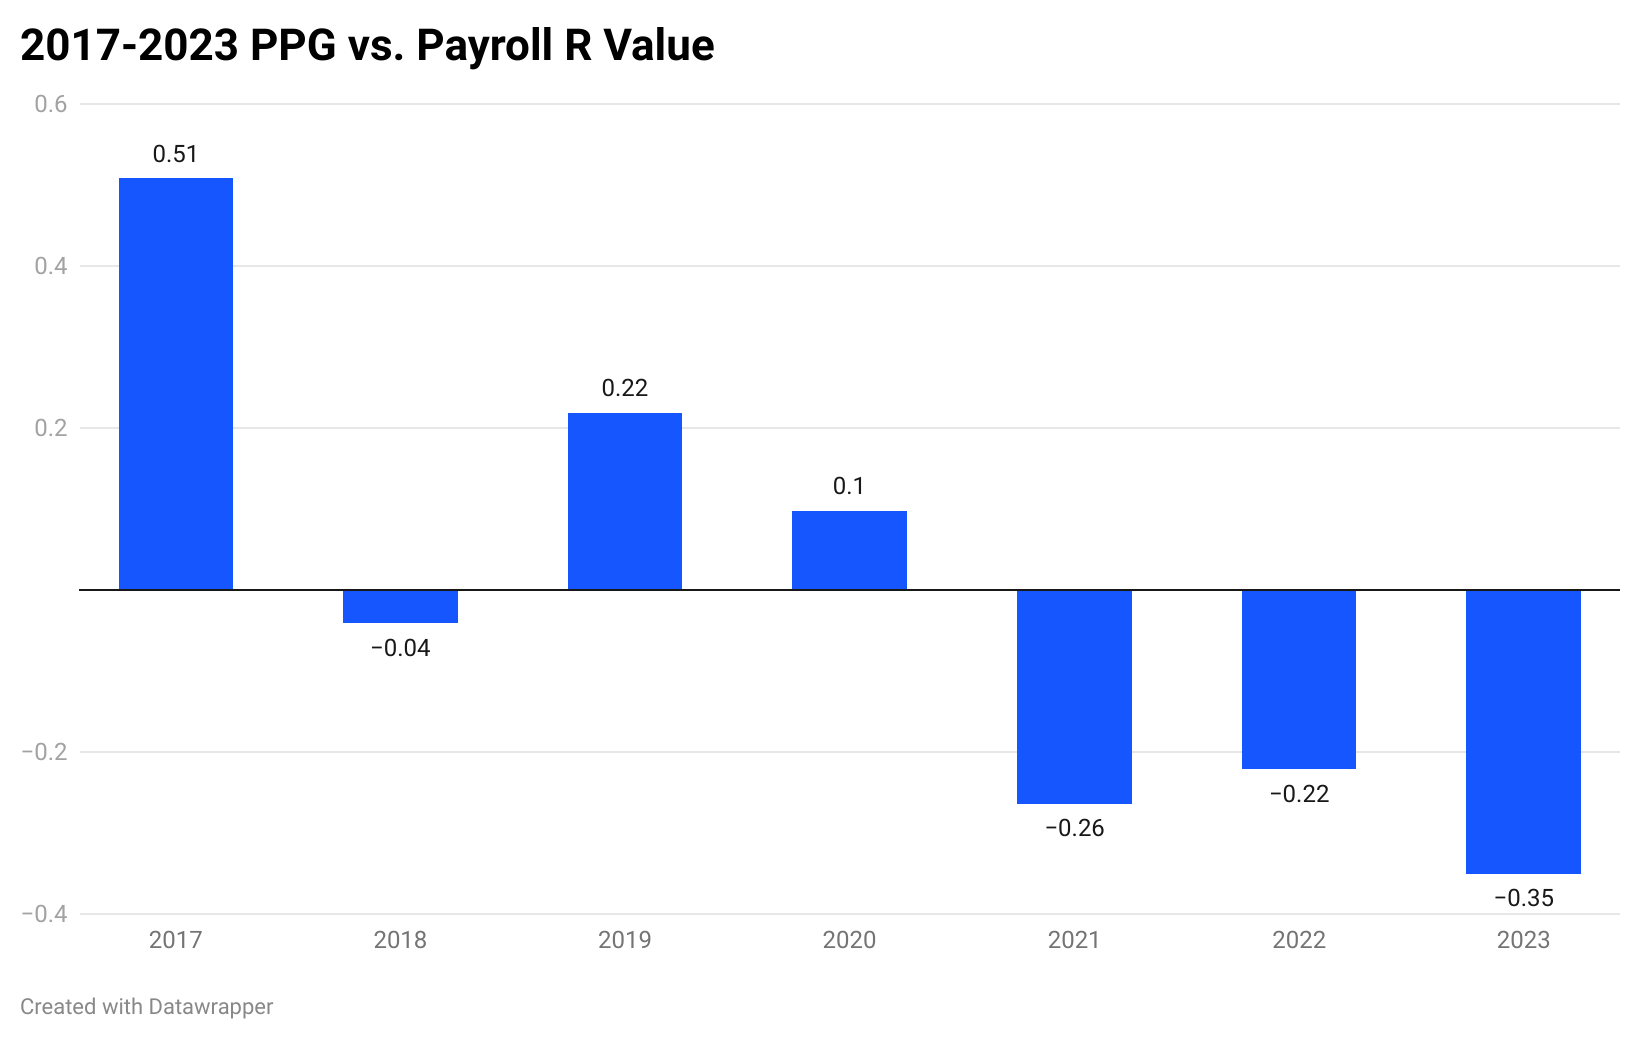
As you can see, the correlation between spend and performance has decreased notably since 2017, taking a sustained dip after 2020 and the onset of Covid-19. As the transfer market began to cool due to the pandemic, we saw teams be successful while spending less on their rosters. Albeit a relatively small sample size, this highlights the importance of having front offices who can demonstrate ability in finding undervalued talent in the global player pool. Not only does having this capability reduce capital outlay, but also it’s how recently successful MLS teams have been built.
Leadership Experience
In the past when we’ve done these analyses, we picked up on something seemingly intuitive: the more MLS experience a club’s top three leaders had, defined as Head Coach, Number One (i.e., GM/SD or CEO), and Number Two (i.e., TD, Head of Scouting, AGM, etc.), the more successful the club was on the field. MLS experience in this case is defined as professional, non-playing experience at a team or the league office.
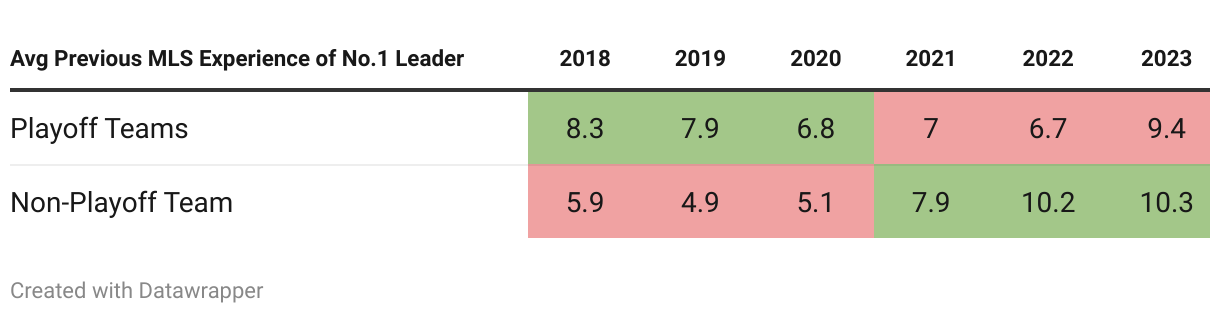
However, the past three seasons have seemingly bucked this trend, with 2023 the latest example of this no longer being the case:
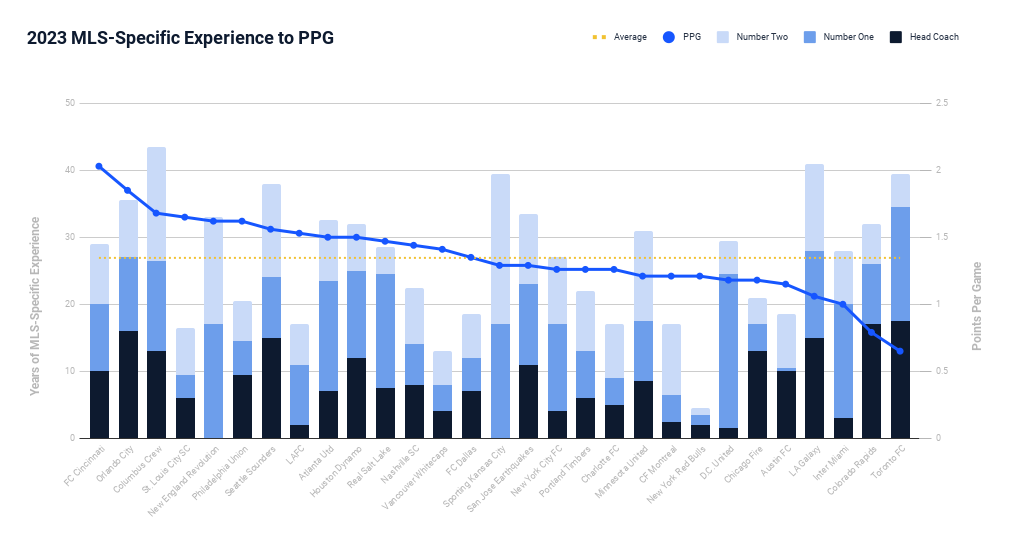
When isolating just the Number One role, who usually has final say on roster decisions and would benefit from understanding the MLS landscape and personnel mechanisms, we see below that teams have been successful in recent years without their top leaders possessing vast experience in this league.
AVG. MLS Experience of Number One Decision Maker, Playoff vs. Non-Playoff Teams
Just to be thorough, even when evaluating the top three’s total experience compared to their teams’ performance, this lack of correlation still is present. Total experience here is defined as front office, league, or other professional non-playing experience in a soccer organization.
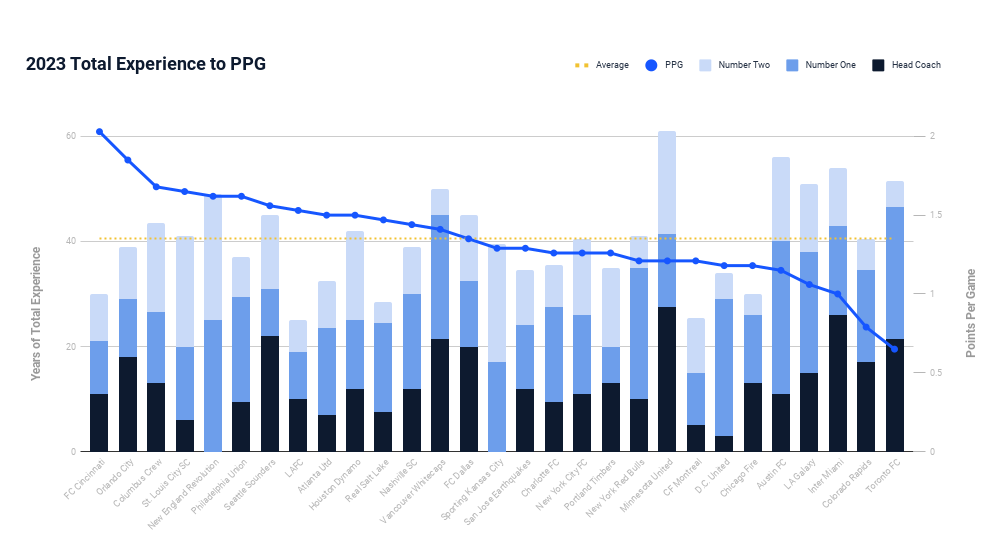
For us at Sportsology Group, the main takeaway here is: that while MLS and total experience is certainly a quality that should be considered in leadership selections, it should not be the ultimate deciding criteria. This league has seen several first-time Number One decision-makers and Head Coaches be successful in recent times. Other factors such as communication skills, clear vision and strategy, technical acumen, etc. should be given equal if not more weight during these important human capital decisions.
Other Considerations
Allocation Money Usage
While tracking DP-level investments is obviously vital when assessing MLS clubs’ performance, we thought it was also worthwhile to evaluate how efficiently these teams used their allocation money with regard to payroll this past season. While we found that there wasn’t any correlation between allocation money spent on payroll with performance success (like with overall spend) we did find it interesting when we tried to measure how successful teams were at putting that allocation money to use.
Based on our understanding of MLS salary regulations, we estimated the amount of allocation money each team was using to buy-down the salaries of certain players (referred now to as “AM Players”) on their roster. Then by matching those players with the G+ metric, we can get a sense of the returns teams got for the allocation money they put to use.
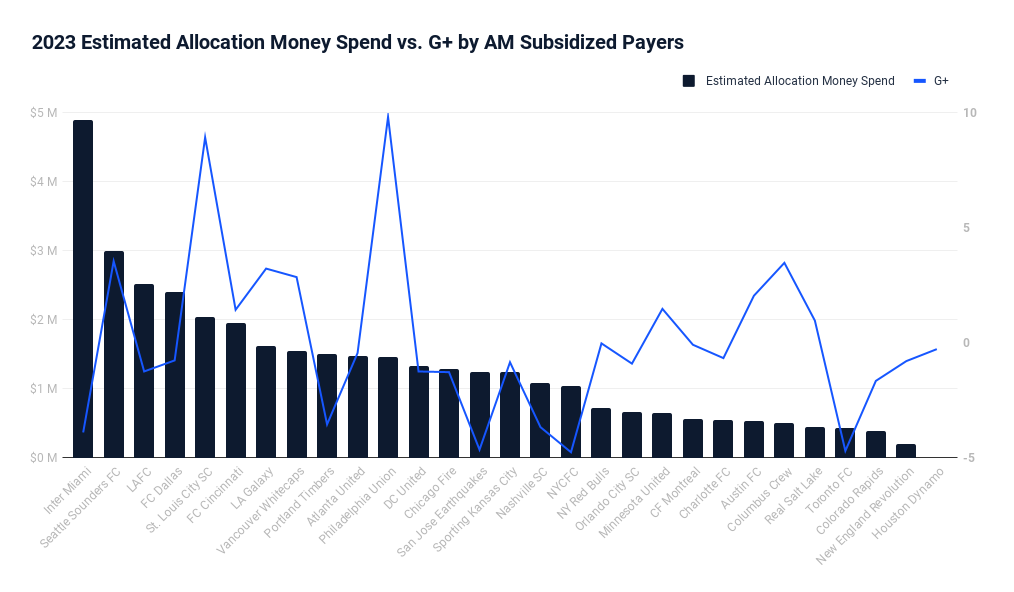
Philadelphia and St. Louis City’s overperformance is largely due to the fact that their goalkeepers, whose performances in 2023 were incredibly impactful, have salaries that were bought-down. However, while 100% of STL’s G+ from AM Players came from Roman Burki, only 41% of Philly’s came from Andre Blake. The Union’s ability to have secured players such as Kai Wagner, Jakob Glesnes, Alejandro Bedoya, and Jack Elliot on AM deals has been massive to their efficient success. Columbus’ relative overperformance, largely driven by Julian Gressel and Steven Moreira, is also worth praising.
Homegrown Player Usage
The last variable we decided to evaluate in this analysis was HG players. While we’ve completed previous studies to measure which teams promote the most homegrown players, give them the most minutes, and sell/trade them for the most value, we wanted to confirm our hypothesis that there wasn’t any notable correlation to on-field success.
As expected, tracking HG player minutes back to 2018, we can see there’s actually a slight negative relationship between the two:
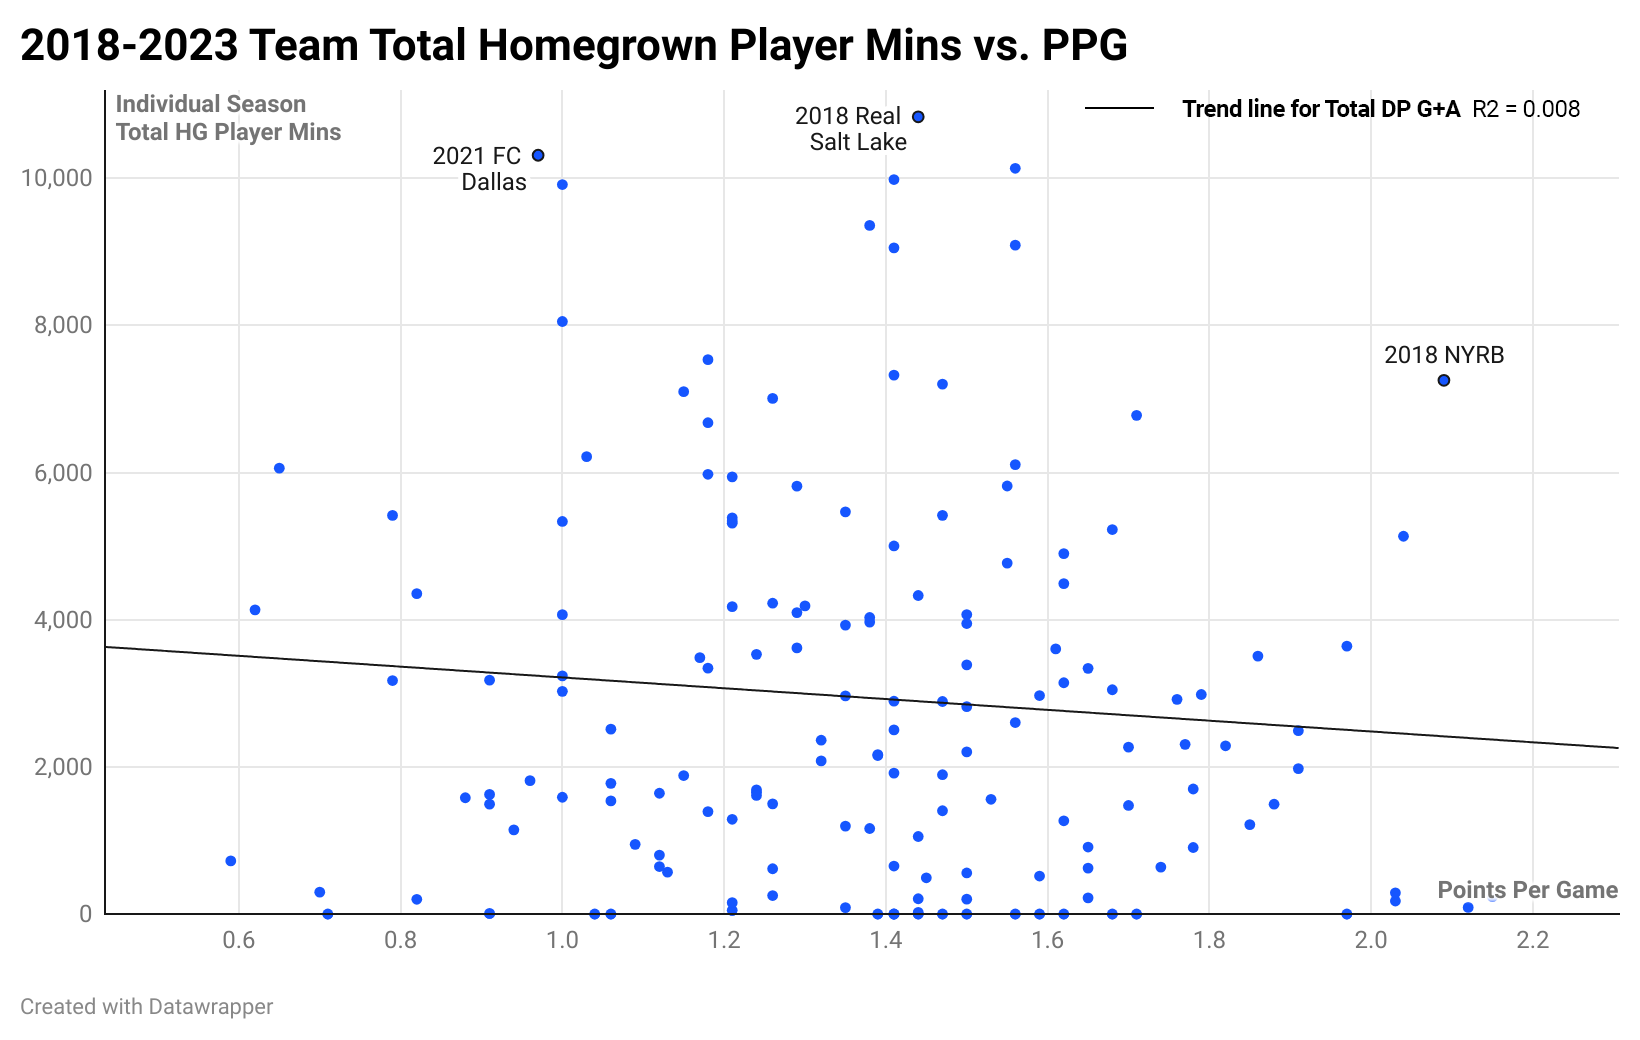
A thought on this could be that the more reliant one’s roster is on homegrown players, the less competitive of a squad they are fielding. However, given the weak correlation, and the wide variety of performance outcomes across the different number of Homegrown minutes given, it’s best to not put too much weight on any conclusion.
Homegrown players will continue to play a massive role in MLS roster construction given the benefits they afford teams from a salary cap perspective, so team performance should not necessarily be the main metric tracked for this area.
Conclusion
In this piece, we make several declarations that go against several commonly held MLS beliefs such as: you need your DPs to perform to win games, MLS experience is vital for key decision makers, DPs are being recruited from all around the world more than ever, etc. We used statistical evidence to back up our findings, attempting to ground ourselves in data-based research. Does that mean we’re right, and many people in this space are wrong? Probably not.
Sample sizes are important, and maybe ours wasn’t large enough to make any definitive claims. We attempted to elect the right metrics to make our assertions, but maybe we chose wrong. Maybe there was more context we missed that would have corrected our findings. And while the use of data has elevated decision-making across this sport, maybe it’s not at the right level yet to formulate insights in the specific areas we looked at.
To assume that our findings are 100% right, and that everybody else in this league and market don’t know what they’re talking about, could rightfully be viewed as naive and presumptuous. While we stand by the analysis that we conducted and the conclusions we arrived at, we admit that there might be factors we overlooked or missed.
To that end, if you are reading this and disagree with some or all of our findings: please reach out. Let us know what you think as we’d love to continue the conversation in this space. It’s our job to!